View Diagnostics
What this covers
The Health tab in Model Builder surfaces errors and warnings about your model's structure. This article explains how to open the Health tab, what the severity levels mean, and how to interpret and resolve each type of issue.
Opening the Health tab
- Open your project in Model Builder.
- Click the Health tab at the top of the Toolbelt panel on the right side of the screen.
- The diagnostic list loads immediately. It reflects the current saved state of the model — unsaved Canvas changes are not included.
The Health tab is read-only. You make corrections in the Canvas, Drawer, or source schema, then return to the Health tab to confirm the issue has cleared.
Severity levels
| Severity | Meaning | Effect on the model |
|---|---|---|
| Error | A structural problem that prevents correct operation | Blocks aggregate build; affected aggregates cannot be built until resolved |
| Warning | A condition that degrades performance or correctness without fully blocking operation | Query routing may be impaired; aggregates may return stale or sub-optimal results |
| Info | An advisory observation with no immediate operational impact | No blocking effect; the model continues to function normally |
Navigating to an affected object
Click any row in the diagnostic list. The Canvas scrolls to and highlights the affected table, join, dimension, or measure. The Drawer for that object opens automatically so you can inspect and edit its configuration.
Diagnostic reference
| Issue | Severity | Cause | Resolution |
|---|---|---|---|
| Join column missing | Error | A column used in a join definition no longer exists in the source schema, typically because the source table was altered. | Open the join in the Drawer. Update the join to use a column that still exists, or remove the join if it is no longer needed. |
| Measure on non-numeric column | Error | A measure (sum, average, etc.) targets a column with a text or boolean data type. | Open the measure in the Drawer. Change the source column to a numeric column, or change the measure type to Count if counting rows is the intent. |
| Fact table missing | Error | No table in the model is designated as the fact table. | Open the relevant table's Drawer and change its Type to Fact. |
| Schema drift detected | Warning | The source table's column list has changed since the model was last synced. | Run a schema sync from the table Drawer or trigger a workspace-wide sync from workspace settings. |
| Aggregate refresh overdue | Warning | An aggregate has not been refreshed within its expected window. | Open the Scheduler panel, check the aggregate's last-refresh status, and re-run the refresh manually if needed. |
| Unused dimension | Info | A dimension is defined in the model but has never appeared in a query. | No immediate action required. Consider removing it to keep the model clean if it is not expected to be used. |
Resolving errors before building aggregates
Any Error-severity diagnostic blocks the aggregate build process for the affected objects. Resolve all Errors first, save the model, then proceed to build or schedule aggregates.
Route trace
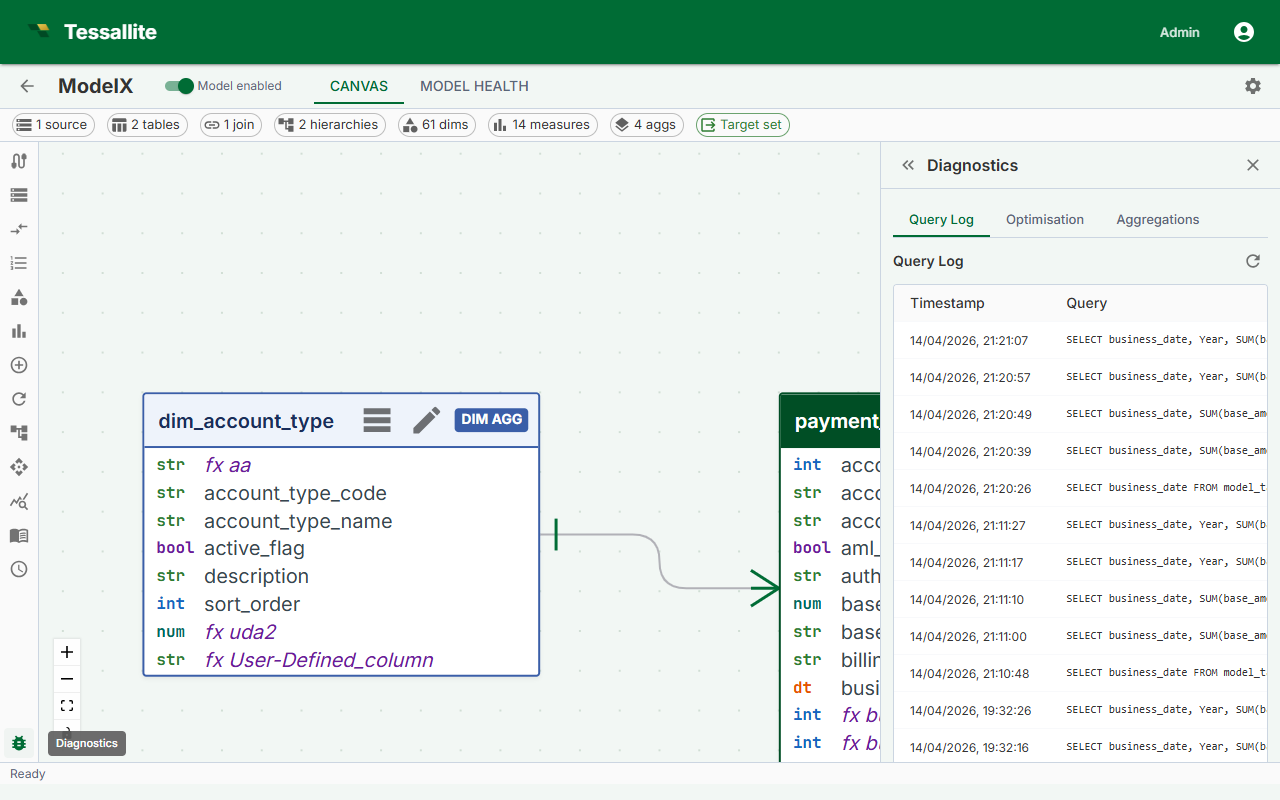
For a query that has already run, the Diagnostics panel can show why it took the route it did. Open the query's detail and click Show route trace to expand the stored decision trail — how the query was parsed and bound, which aggregates or pocket tables were considered, why each was accepted or skipped, and which engine finally served the result. Click Hide route trace to collapse it.
This is the fastest way to answer "why was this query slow?" or "why did it hit the source instead of my aggregate?". The trace usually points straight at the cause: an aggregate that was missing, stale, or simply did not match the query's shape. If a query has no stored trace yet, the panel says "No stored trace for this query" — run the query again to capture one.
Source statistics (BigQuery and Spark)
Tessallite collects column-level statistics from your data sources to inform aggregate design and model health. The statistics collector works differently depending on the source type:
| Source type | Statistics method | Precision |
|---|---|---|
| PostgreSQL | pg_stats system catalog (no extra query) | Exact (from ANALYZE) |
| BigQuery | INFORMATION_SCHEMA.COLUMN_FIELD_PATHS + APPROX_COUNT_DISTINCT | Approximate cardinality (HyperLogLog) |
| Spark / Hive | DESCRIBE EXTENDED + ANALYZE TABLE COMPUTE STATISTICS | Exact (from COMPUTE STATISTICS) |
What statistics are collected:
- Row count per table
- Cardinality (distinct value count) per column
- NULL percentage per column
- Min/max values for numeric and date columns
How to trigger a refresh: Statistics are collected automatically during schema sync. For non-PostgreSQL sources, you can also trigger a manual refresh from the table's Drawer by clicking Refresh Statistics.
Precision differences: BigQuery uses APPROX_COUNT_DISTINCT, which is based on HyperLogLog and may differ from the exact count by up to 1-2% for high-cardinality columns. PostgreSQL and Spark provide exact counts. The Diagnostics panel displays an "(approx)" label next to BigQuery cardinality values.